Dataset
This Mushroom dataset contains 8124 instances, 22 attributes for different funguses, and 2 classes, poisonous and edible with 48.2% and 51.8% of class balance respectively.
Data preparation
Class balance
The class balance is analyzed in order to discern if it is necessary to apply any synthetic data technique to balance classes and not create biases in the results. In this case it is not necessary as can be seen in the bar graph


Data preparation
Missing values
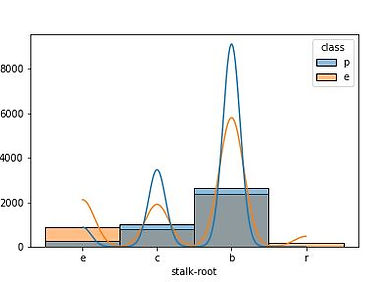
The next step is to know if there are missing values, looking at attribute by attribute, it was found that only one attribute had missing values, symbolized with the "?" sign. In the class-based distribution for the stalk-root attribute, it shows the missing values.
Data preparation
Missing values
Based on the distribution of the data, a data imputation is performed. The specific technique is the imputation of means by class. This technique generates data for each missing value based on its class and the mean of certain neighbors. By applying this technique, the distribution of this attribute was obtained again and it was observed that the data were correctly imputed.


Data analisys
Selecting better attributes
In this section, it was proposed to attack the problem in three different ways, an analysis was made using Pearson's Correlation, PCA and MCA. After extensive experimentation using machine learning methods (KNN and Decision tree) and K-fold. The best approximation was using the Pearson correlation matrix.
Results
After selecting the most relevant attributes using the three approaches, the nearest neighbor (KNN) and decision tree (DT) methods were trained and evaluated using various metrics. The best results were when using Pearson matrix and DT.


